You may be familiar with the data that FDA publicly shares on devices designated as having breakthrough status, and devices ultimately approved after receiving that status.
As of September 30, 2024, 1041 devices had received breakthrough designations, and 128 of those devices had received ultimate clearance or approval. Inquiring minds want to know, though: what about the difference, the 913 devices granted breakthrough designation but at least not yet approved or cleared?
I wanted to learn as much as I could about those devices, so I submitted a FOIA request. The numbers are not going to match up with the public data, in part because my FOIA request only extended through June 1, 2024. But the data FDA shared in response to my FOIA are quite revealing, both about where industry has placed its development priorities in terms of potential breakthrough devices and where FDA seems inclined to grant breakthrough designation. We also learned how quickly FDA responds to requests for breakthrough designation.
Results
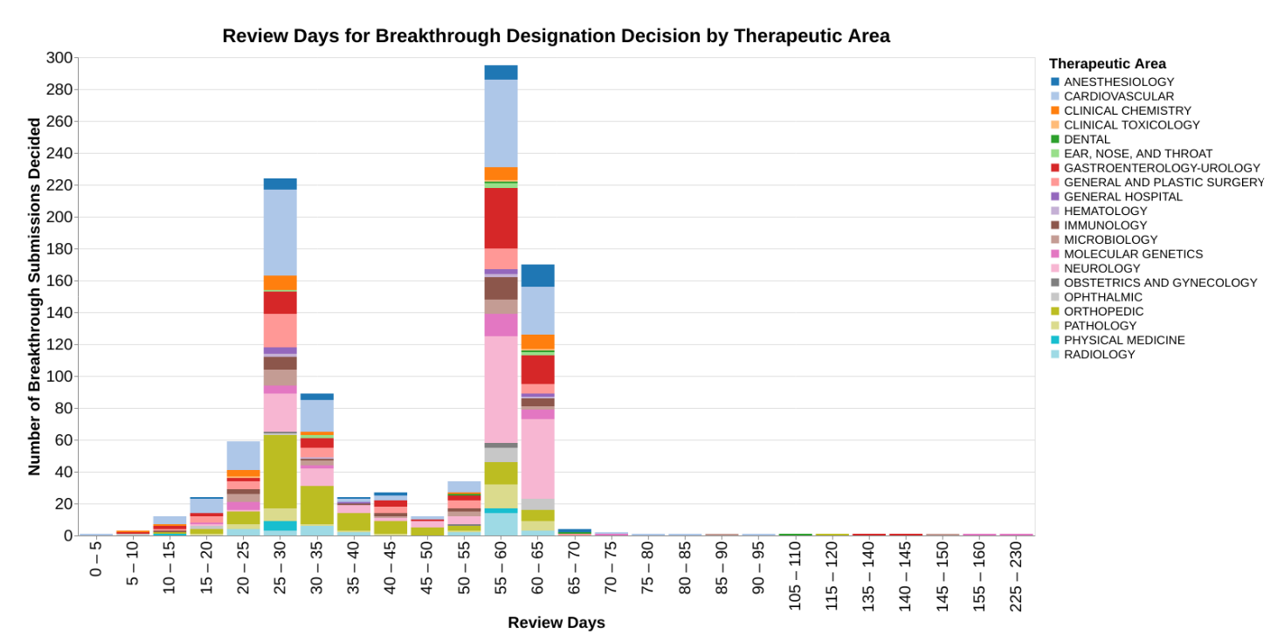
Let’s start with how quickly FDA responds. As a preliminary note, these data only reflect where the designation has been granted, not whether designation has been rejected. I have no data on rejections. But at least for those where FDA responds favorably, here’s what the responses look like in terms of timing by therapeutic area.
I want to point out that the x-axis is a little unusual in that I have binned the responses into groups of five days to avoid a whole bunch of skinny bars. From a public policy standpoint, 5 days doesn’t really matter. I would point out that the chart has a rather lengthy right tail, and because of the binning, I also set this up so that the x-axis is not continuous where there are no data. So, for example, there are no data between 160 days and 225 days, so those of bars appear right next to each other even though there’s a big gap in time.
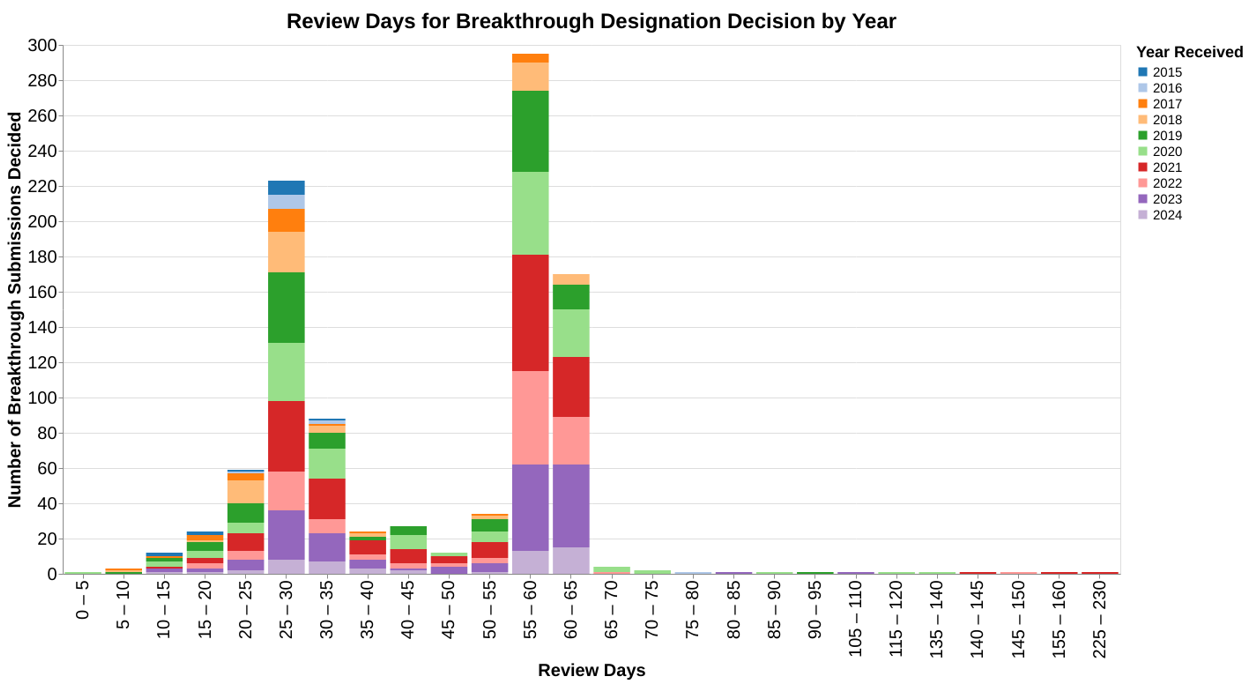
This chart shows the review time data in light of the therapeutic areas so you can see whether there’s any differences between how different therapeutic divisions within CDRH respond to these requests. I then did a very similar chart where the color coding was the calendar year (as opposed to fiscal year) in which the request for designation was received, to see if the program has changed over the years in terms of review times.
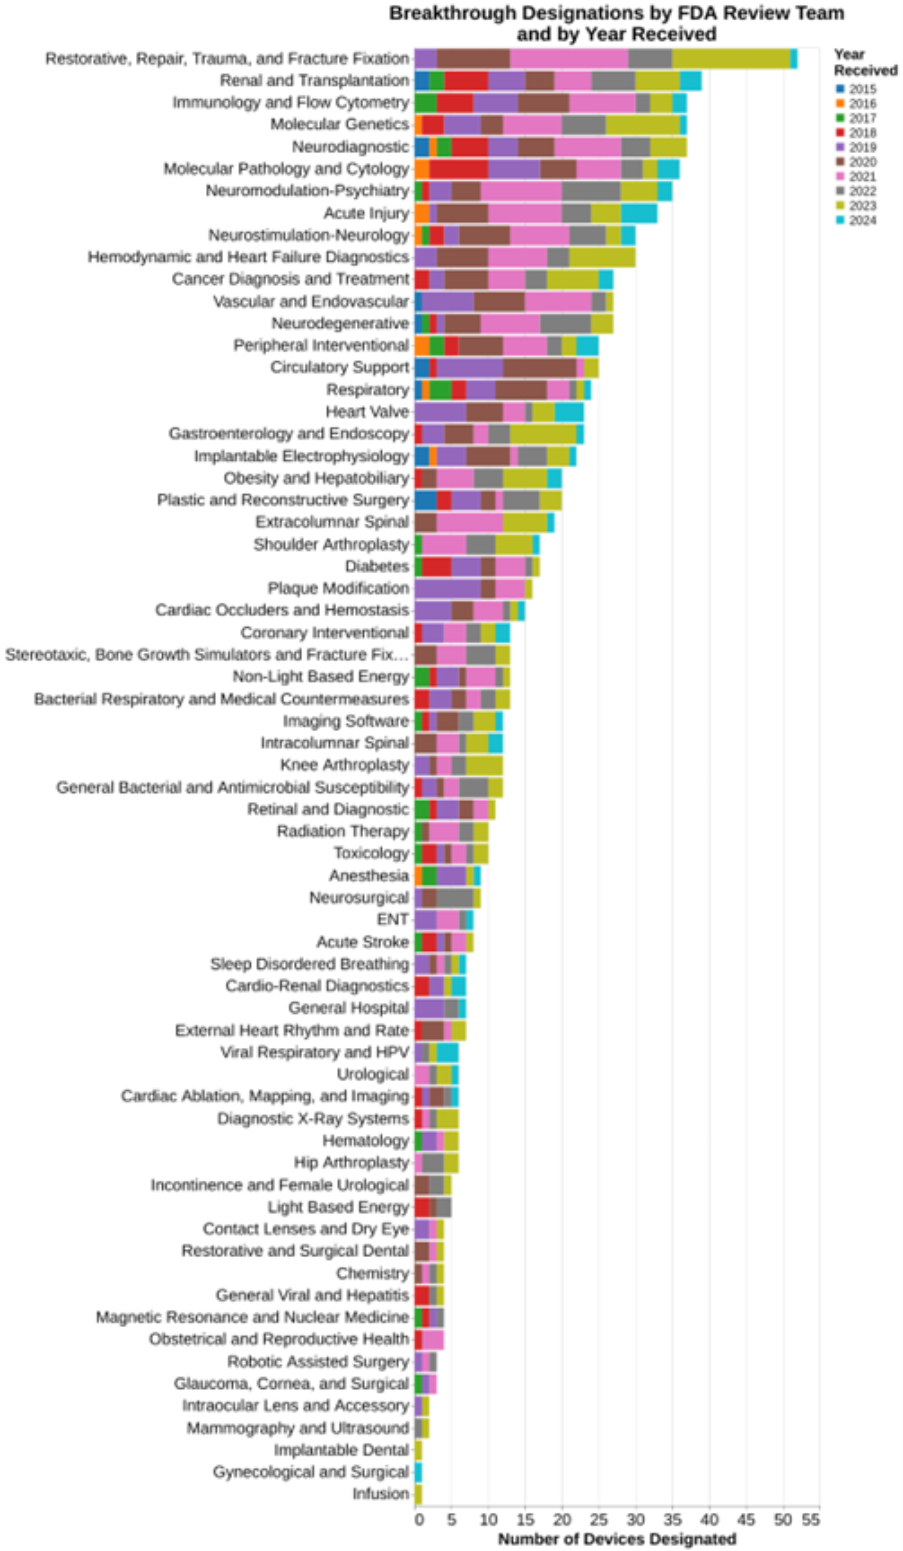
And finally, I wanted to understand what types of devices were being submitted and granted breakthrough designation. In this regard, the public data already provided the broad therapeutic areas. But I deliberately asked through FOIA for data that took it all away down to the specific FDA team reviewing the breakthrough designation. Using the 81 team labels, here are data showing what teams at FDA granted the most breakthrough designations.
Again, the data set included no data on those that were rejected.
Methodology
In these blog posts, I typically try to offer insights using data science techniques such as combining publicly available data sets in unusual ways. In this post, though, I really didn’t use much of my data science training, but rather had to use my training as a regulatory attorney to navigate FOIA. The goal was to get some useful data that hadn’t been shared publicly previously.
I should not make it sound as though I used any special skill or tricks to get the data. Initially, I told FDA that I was going to hold my breath until they gave me the data. That never worked with my parents, and it didn’t work with FDA. After my wife revived me with smelling salts, I decided I just had to wait.
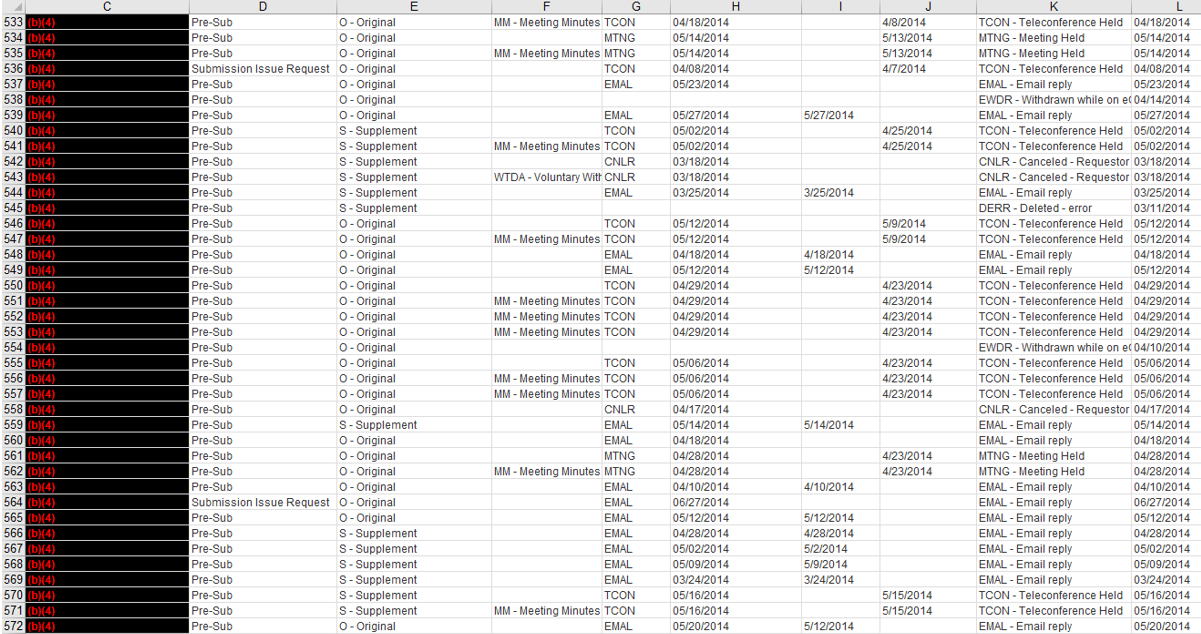
My goal is always to get useful data, but as an illustration this month I received a response to my 2022 request for data on pre-submission meetings. Here’s what I got:
Indeed, I got 7000 lines of that in an Excel spreadsheet. I really couldn’t think of any data analysis to do to it.
In fairness to FDA, that related to the submissions ultimately filed for clearance or approval after presubmission encounter. I also received this on the underlying Q-submissions.
The problem with the data is it doesn’t give me any anchor points. It doesn’t tell me when the request for Q submission meeting/tcon was filed, so I can’t figure out how long it took to get the response. Nor does it tell me obviously the submission that ultimately was filed, so I can’t see how far in advance these meetings are normally taking place prior to approval and do any analysis about the influence of particular therapeutic areas on speed or frequency. I can’t even with much confidence determine how many Q-submission meetings typically occur related to a specific marketing submission. I just can’t do anything at all with this data because the dates that are provided are all essentially the same dates, the date the action was taken. And all linkages are stripped out.
But I digress.
With regard to the breakthrough designation program, I did get the date FDA began its review and the date they granted the request. I also received information on the therapeutic divisions and the specific therapeutic teams within each division to which the request for designation was assigned.
The only problem was, they were all in code! That’s right, the data set I received was all in code regarding the organizational units at FDA. Regarding therapeutic divisions, those codes are publicly available so that was no problem. But there was no publicly available information on the 81 FDA review teams that I could find. So, I had to submit a new FOIA request for the three page list of the 81 codes and that took another nearly 6 months.
Again, I wish I could tell you that as a regulatory lawyer I was extremely clever and figured out a way to get all this information quickly. But that’s just not the case. It took years.
Analysis
Let’s break the charts down into two buckets.
Timing of the FDA Decisions on Request for Breakthrough Designation
For the first two charts that involve the amount of review time for these requests for breakthrough designation, it’s important understand that this particular nonpublic data set that was given me uses as a starting point “date FDA review started.” That’s not the same thing necessarily as the date FDA received the information. In fact, it makes me wonder if that’s the start after an administrative review, although the agency also makes it clear that breakthrough device designation requests are not subject to an acceptance review. Anyway, the phrasing just makes me very suspicious, specifically declaring that it’s the date the FDA review started. That’s often very different typically than the date received.
Here’s what FDA publicly says on its website about the timing of its review of breakthrough designation requests.
The FDA intends to request any other information needed to inform the Breakthrough Device designation decision within 30 days of receiving your request. You can expect to receive a letter communicating the FDA's decision to grant or deny the Breakthrough Device designation request within 60 calendar days of the FDA receiving your request.
The data shows that the decisions are clearly bimodal, many decisions made at roughly 30 days and many decisions made around 60 days. From the data, I’m not able to discern why. I ran two different sets of analysis to tie it to therapeutic area and tie it to calendar year, wondering if the program evolved over the last 10 years. But neither of those factors seem to explain the bimodal distribution.
The mechanics for requesting breakthrough designation are spelled out in the June 2023 FDA guidance on Requests for Feedback and Meetings for Medical Device Submissions: The Q-Submission Program and the Breakthrough Devices Program guidance. In the second of those guidance documents, on page 21 FDA explicitly says:
FDA will issue a grant or denial decision for each Breakthrough Device designation request within 60 calendar days of receiving such a request. 54 In general, FDA intends to interact with a sponsor by Day 30 regarding any requests for additional information needed to inform the designation decision.
The referenced footnote 54 provides a statutory reference for breakthrough decision-making, section 515B(d)(1) of the FD&C Act (21 U.S.C. 360e-3(d)(1)), as well as a discussion of the appealability of the decision.
The bottom line is I’m not smart enough to discern from either the data FDA provided me or the guidance documents as to why the distinct bimodal decision-making at 30 and 60 days. Maybe somebody commenting on this post can add greater insight.
Therapeutic Areas of Focus for Breakthrough Designations
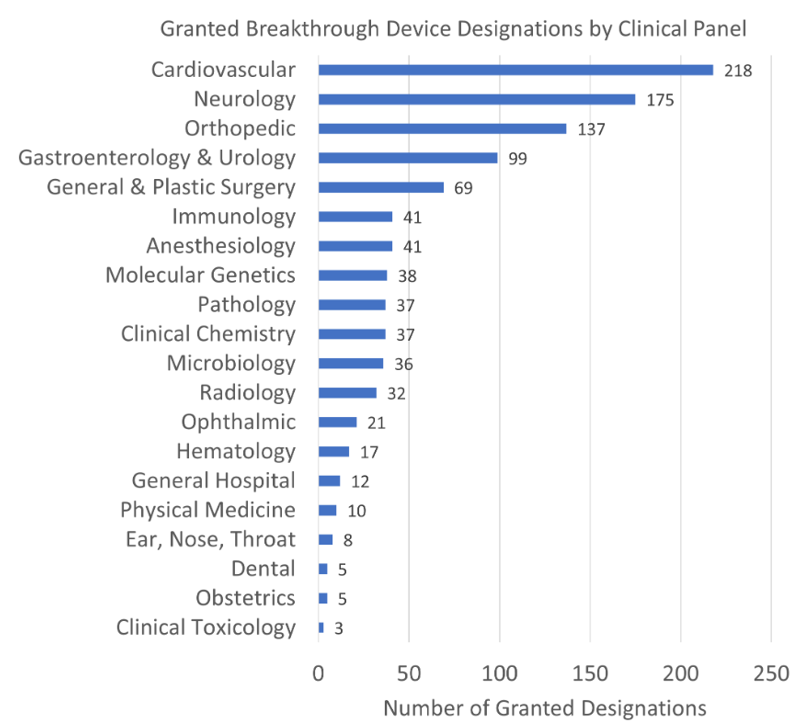
As already explained, I was able to go beyond the mere therapeutic areas represented by the 19 classification panels, to the underlying 81 FDA review teams. That adds greater granularity than was previously provided on FDA’s website. The website merely provides this level of detail:
The added level of detail shows that an orthopedic category displayed above as the third most common in FDA’s chart actually includes the very most common subcategory of “restorative, repair, trauma and fracture fixation.” Cardiovascular, in contrast the number one therapeutic area, actually is comprised of numerous individual subareas where granting breakthrough designation is common.
You can read the list as well as I can. In the comments on this blog post, I’ll be particularly interested in what strikes you clinically as significant, i.e., areas where there is well known to be a need for breakthrough devices.
As I said at the outset, breakthrough device designations reflect a combination of factors including FDA’s assessment of where clinical need is greatest, but also industry’s assessment of where they want to invest money to develop these breakthrough products. It isn’t possible from these data to suss out the influence of those two different factors.
Conclusion
I wanted to obtain and publish this data because I think there is fair discussion that should be had about how breakthrough status is serving the public good. Is the program really directing FDA resources to where the need for breakthrough technologies is the greatest? I have no idea, but I suspect the wisdom of the crowd would have great insight here. Again, if the areas of greatest need are not statistically the largest categories, it could be due to either how the agency makes decisions or where the industry puts its priorities.
In another post published in 2022, I confessed to not being a fan of the breakthrough program because (in updated numbers) over 900 devices have been granted breakthrough status and at least not yet achieved clearance or approval. The ratio of devices granted breakthrough status to those achieving clearance or approval is typically about 10 to 1.
In the experience of many consultants with whom I spoke, they are not fans of the breakthrough program because FDA actually heaps more burdens on devices granted breakthrough status than those not granted such status. This may be subconscious, but I submit it is the product of FDA spending more time working with those companies. In the prior post, I also question whether breakthrough status actually produced quicker clearances or approvals, suggesting that certainly in the case of 510(k) devices, it does not.
I suggest that this be an area of discussion among FDA stakeholders as to whether the breakthrough program is well directed at those clinical areas most in need, and effective in terms of delivering the breakthrough devices that patients are waiting for in a timely way.
* * * *
The Unpacking Averages® blog series digs into FDA’s data on the regulation of medical products, going deeper than the published averages. The opinions expressed in this publication are those of the author(s). Subscribe to this blog for email notifications.
